Upload your experiment data using CSV or National Instruments TDMS files.
Create dashboards to analyze individual experiments or to compare them with eachother.
Annotate your graphs, keep your dashboards private or share them with the world.
MATLAB Plugin
MATLAB Plugin
Upload or download data to/from your cloud database with a single MATLAB command.
MATLAB is the ideal gateway to your CURVE cloud database and CURVE web dashboards whether you generated the data or have a log file output by a DAQ system.
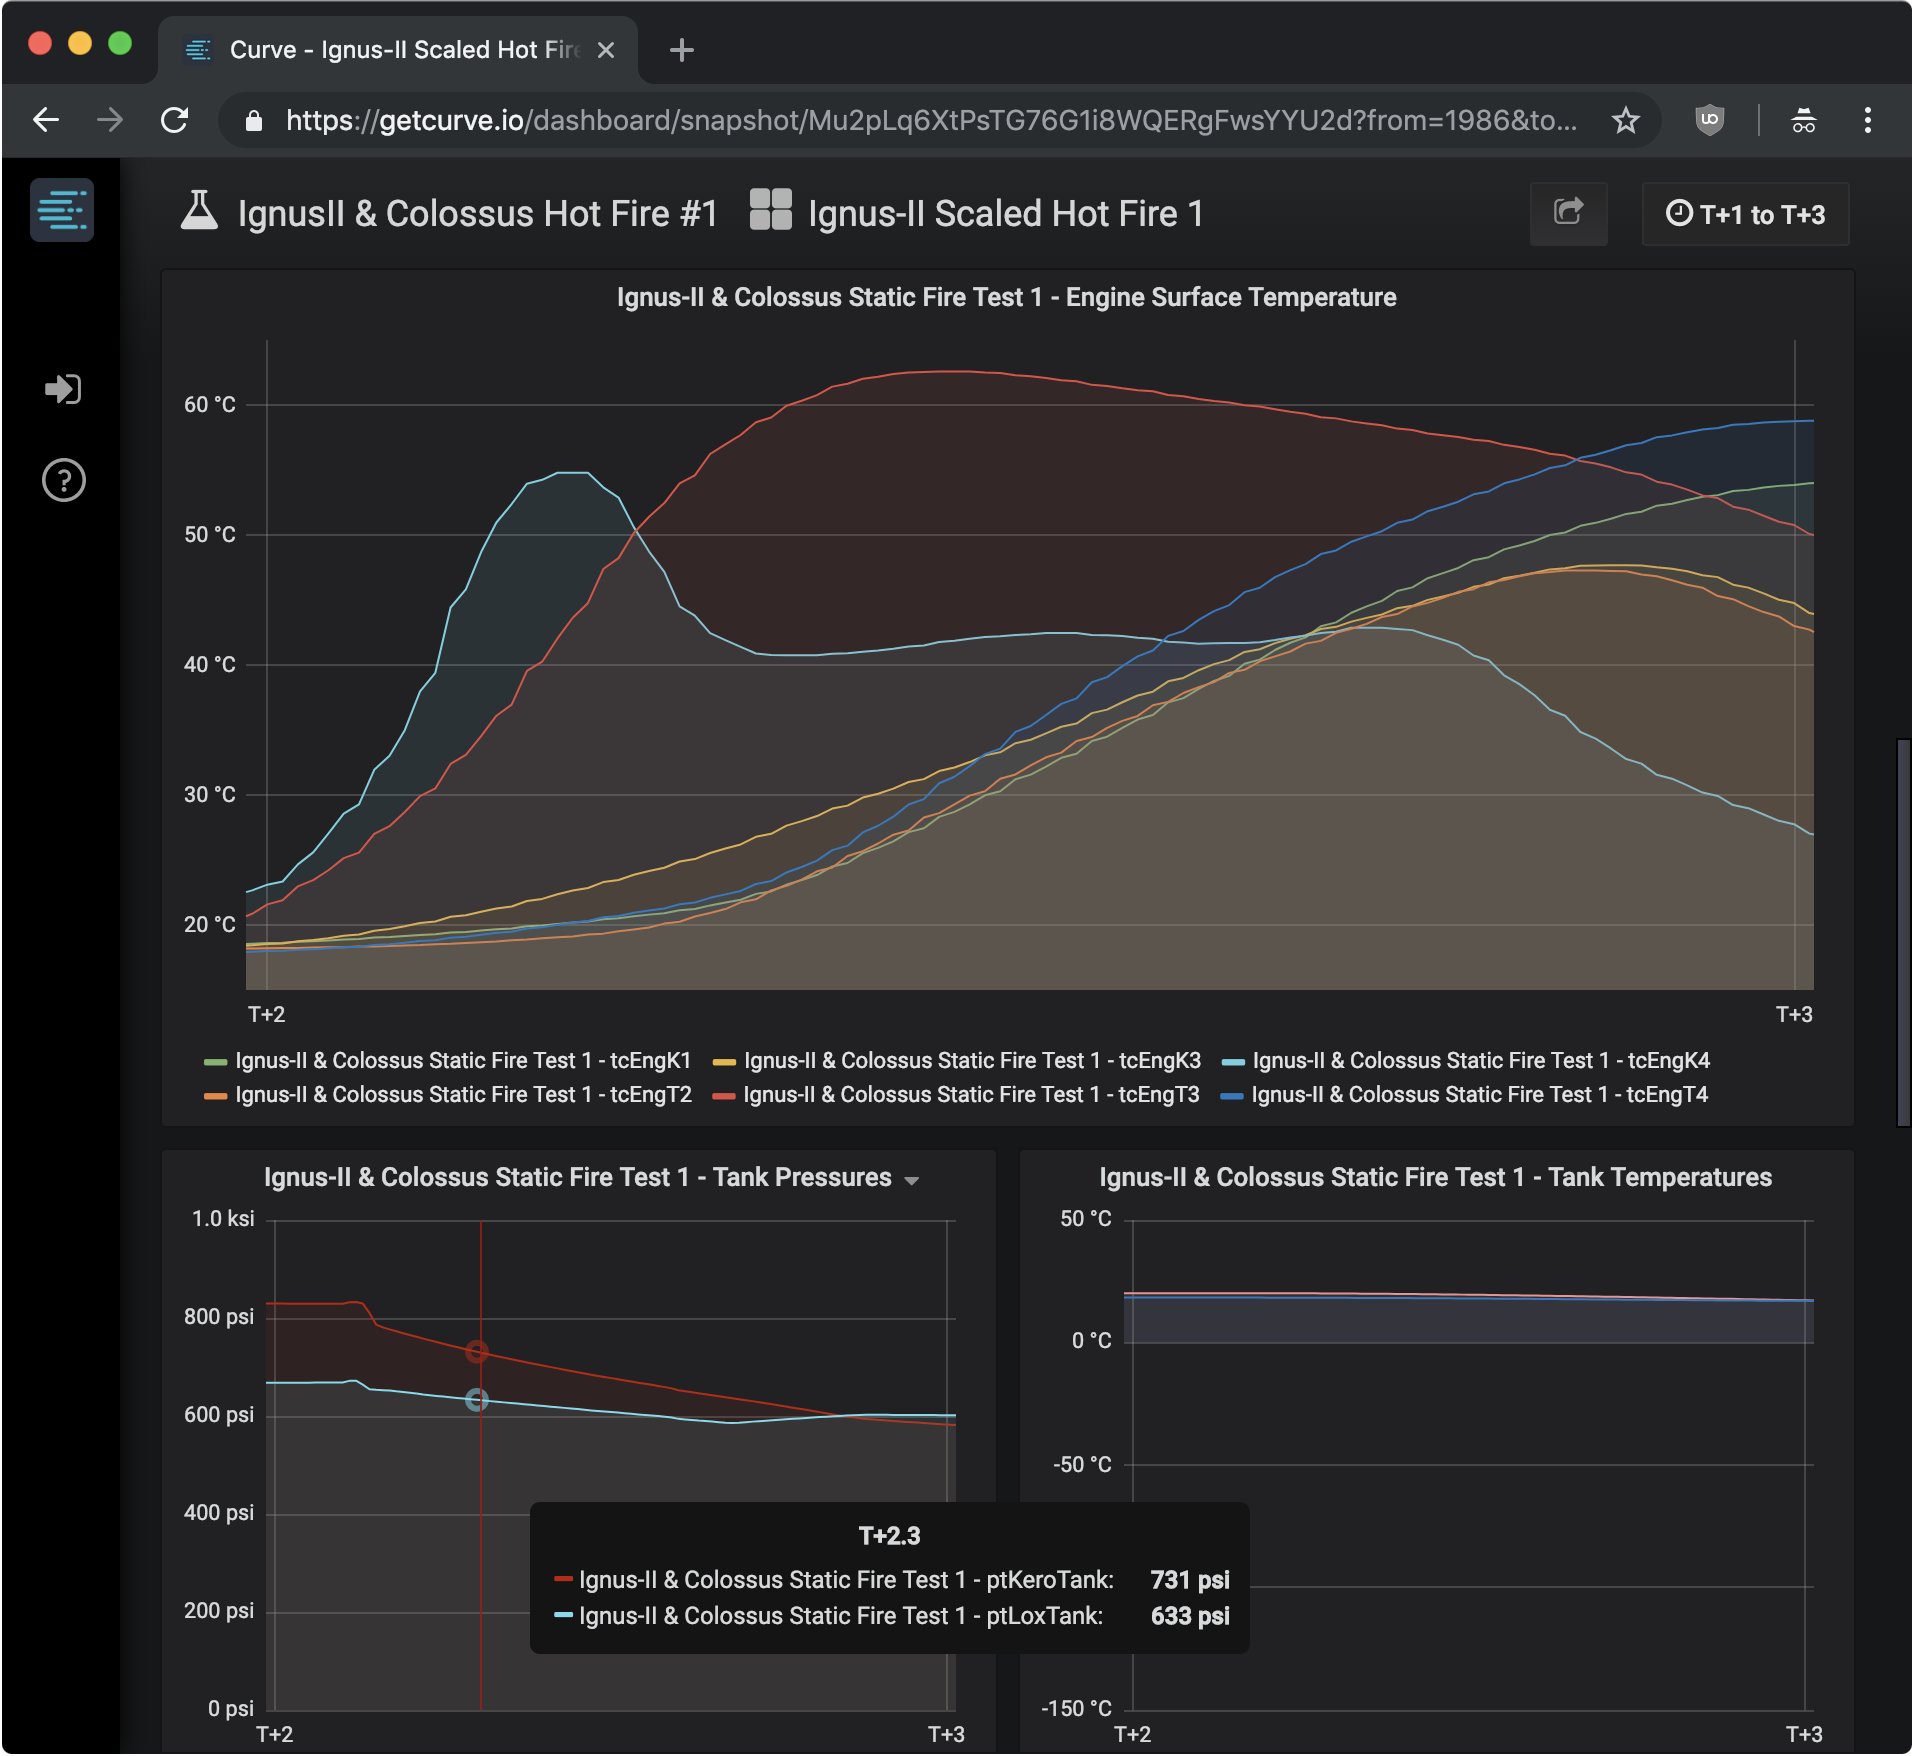
 CURVE in action